Do you know what your website’s analytics say about you? Do you know what kind of web traffic you’re getting and which articles or stories are your most popular?
Reading and understanding your website’s analytics is not that difficult. You just have to know where to look and what to look for. The problem is that Google Analytics analyzes so much stuff that you easily be overwhelmed by everything. So instead, just focus on a few statistics that will give you a general idea of how you’re doing.
We’re going to get a little bit in the weeds here, but this is important information to have. If you’re not particular tech-savvy, ask someone to help you with this. And if you are tech-savvy, then this should be a walk in the park.
Your web traffic is all easily measured by a web analytics package. For most of you, that can be Google Analytics. For a few of you, that’s not an option, but there’s a workaround. Let’s start there.
WordPress.com Does Not Have Google Analytics
You can use Google Analytics most every place, but you can’t use it if you have a WordPress.com website. WordPress offers four basic packages: Free, $4/month, $8/month, and $25/month, and you don’t get Google Analytics integration until you cough up reach the $25/month ($300/year) level.
In other words, there’s no chance for Google Analytics on WordPress.com unless you want to spend $300 per year. And it’s not that important. There are other ways to get this done, like getting a self-hosted WordPress site at GoDaddy or another Internet service provider (ISP) for $8 – $10 per month and installing Google Analytics on your website.
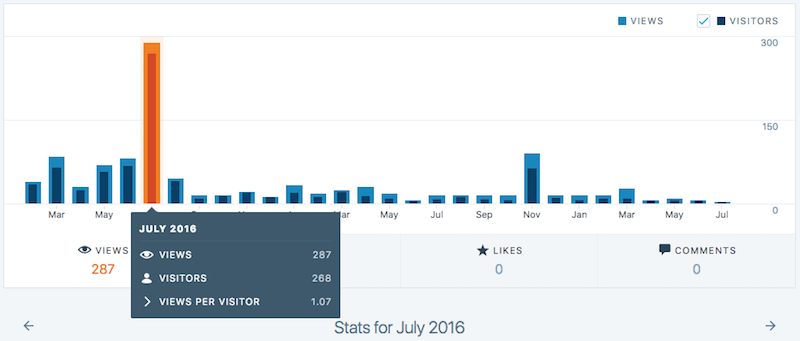
If you do have a WordPress site, check your dashboard for basic analytics. It will show you the number of visitors to your site each day, how many pages they saw, and which ones they read.


But it’s a limited look, so if your website — or your ego — depends on knowing more details, you need a site that lets you use Google Analytics.
Everything Else Has Google Analytics
Like I said earlier, if you have a self-hosted WordPress site on GoDaddy or another ISP, or if you have literally any other blog platform, like Tumblr or Blogger, you can install the Google Analytics tracking code in your blog.
There are instructions on the Google Analytics page to show you how to do it. And if you can’t manage it, ask around. There are people who can do it for you.
Once you’re there, there are a few numbers you want to pay attention to. Select a time period you want to monitor — I usually look at the previous month (June 2018), but I can also look at the last 30 days (i.e. June 2 – July 2).
These are the stats in question:
- Your Users How many people came to visit. These are your overall users. You can also check out your new users, which will show you the number of people who have never been to your website. But the “Your Users” number shows all of your visitors.
- Your Sessions More or less a website “visit.” Someone showed up, looked at a few pages, signed up for your email newsletter, left a comment, and then left again — that’s a single session. People can visit one page and leave, or they can read 10 pages, in a single session.
- Session Duration How long did people stay on your website during their session. Longer is always better. Anything below 10 seconds is not good.
- Bounce Rate If people visit one page and leave again, they “bounced.” If they visit one page and then click over to a second page, they didn’t. It’s very rare to have a bounce rate below 70% for a blog, because people usually read a single blog article and leave again. But people who show up at the front page of your website and click around won’t bounce.
Pages traffic
There are a few more stats, so I wanted this to be its own section. This is the important stuff that writers really ought to know.

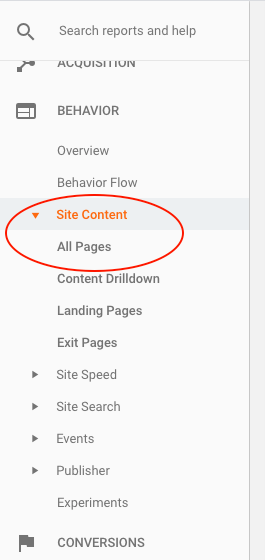
In your left side bar, scroll down to Behavior, and click on Site Content, then click on All Pages. What you’ll see is the URLs of all the pages that people have visited.


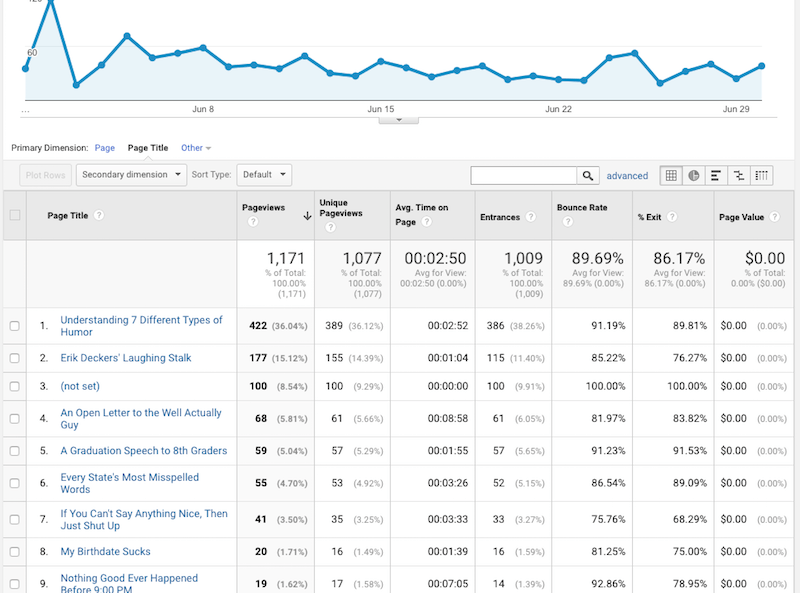
- Page Views: This is how many people looked at that page. If you see an entry marked /, that’s the front page of your website. Everything to the left of the / is your domain name — www.erikdeckers.com, for example. They leave it off so as not to clutter up the page — but everything to the right is the URL to a particular page, and it appears on this list.
- Unique Page Views: Some people in the “Page Views” column visited your page more than once, which is why the number is higher than this one. The “Unique Page Views” column shows the number of unique visitors (i.e. Users) who read that page.
- Avg. Time on Page: How long did people stick around and read your article. Anything under 10 seconds is not good, anything over 30 seconds is pretty good, and anything over a couple minutes is great! It means people are reading your stuff and sticking around. If you have a low time, there may be some formatting issues to fix.
- Entrances: How many people came to your site directly to that page? They showed up through Google, you tweeted it or put it on your Facebook page. They didn’t just show up to your front page and clicked to it, something got them to that page directly. This column shows those people.
- Bounce rate: Just like the bounce rate above, but this is for an individual page. Again, bounce rates will be high for blog articles, not so high for your front page. There are ti[s you can try to reduce your bounce rate, but it’s not a big deal.
There’s a lot more to understanding Google Analytics, but it’s not really important for the kind of work we’re doing as writers. If you were selling a lot of products online and were measuring your visitors in thousands per day, or if you sold a lot of materials through your large ecommerce store, then you’d want to know these things. But we just want to see who’s visiting, see what they’re reading, and see what they like.
As you learn more about Google Analytics, keep an eye out for a few other metrics, like where readers are coming from, what source brought them there, and even the demographics of your reader.

Lyn Hill
Interesting